
Eaze: Mapping the Customer Experience
Using Research and Growth Analytics to Explore users' key interactions and Behaviors

Eaze is an on-demand delivery service enabling patients to access medical marijuana easily, quickly and professionally via any connected device. For dispensary partners, their technology handles the end-to-end process from patient verification, to ordering, delivery logistics and customer service. Eaze is quickly expanding to all states where medical marijuana is legal, and an important part of Eaze’s growth strategy is understanding how customers on the demand side of the business interface with the company and its brand.
The scope of the project included visually illustrating customer’s actions, motivations, and feelings throughout throughout the entire lifecycle, from past experiences to referral, and highlights opportunities and takeaways to improve user experience and increase customer retention. As the Lead Product Designer, I managed a team of 6 designers and 4 growth marketers through customer experience mapping. In addition to leading all aspects of research, analysis, and design, I served as the point of contact for the client and was responsible for keeping the project on time and within scope.
Design Process
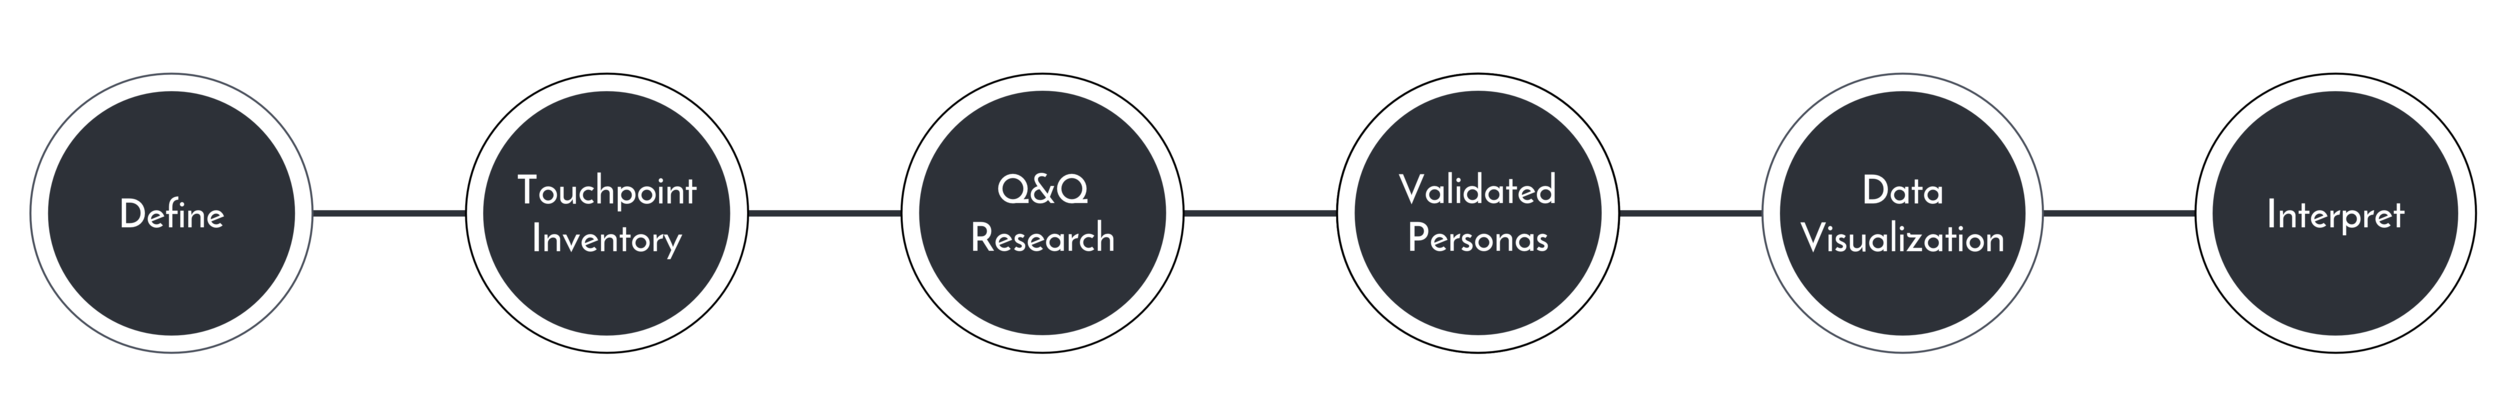
Define
Instead of mapping a general user experience with Eaze, we wanted to explore the differences in retention, customer satisfaction, and overall behavior among user types. We identified three different customer segments:


Touchpoint Inventory
By cataloging intentional and unintentional interactions Eaze currently has with potential and existing patients, we could view how different areas within the company work together to strengthen or weaken a patient's experience across channels and lifecycle stages. We worked with internal stakeholders to verify the inventory presents a comprehensive and holistic view of all interactions.
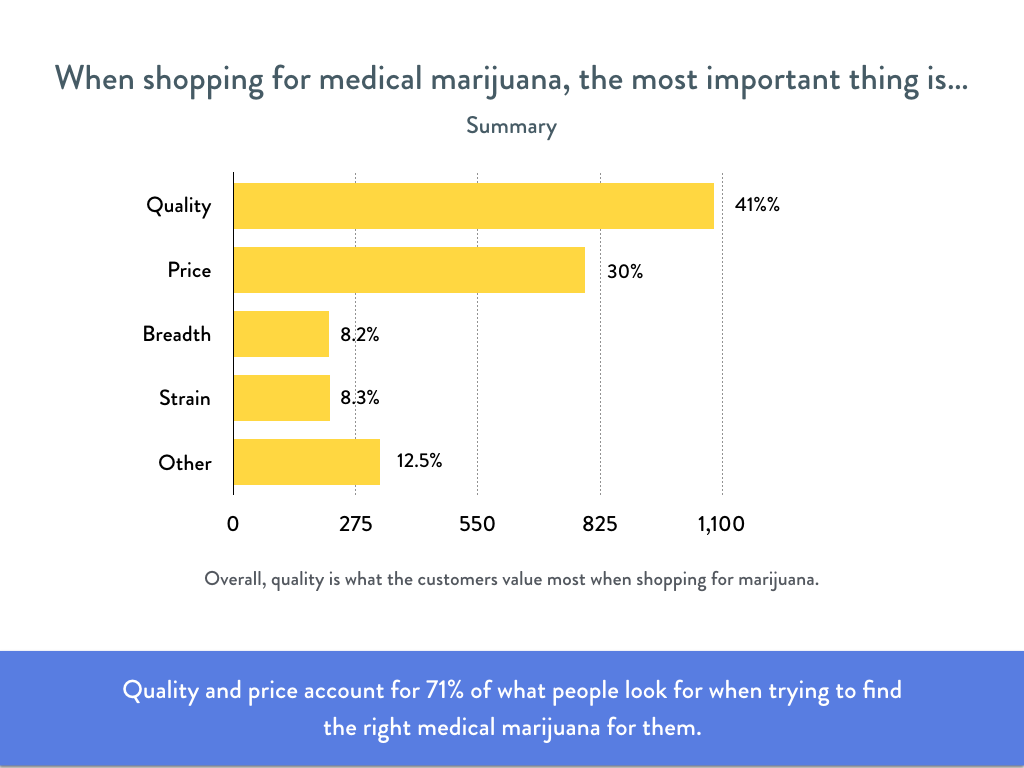
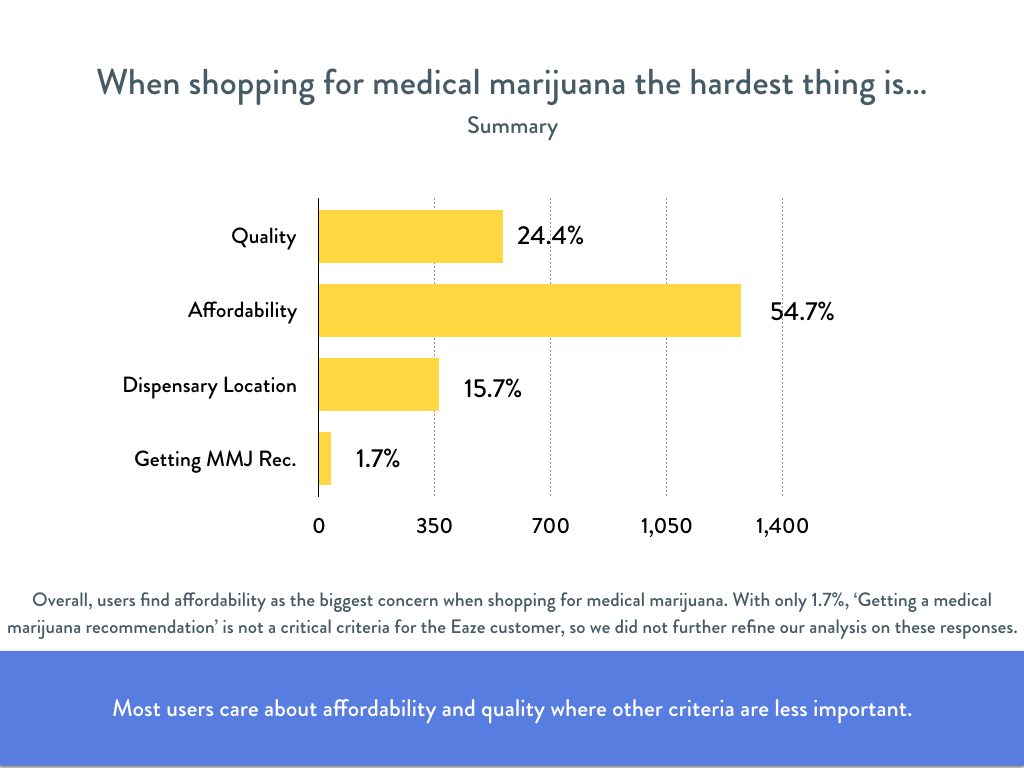
Q&Q Research | Survey Data
We sent out a 30+ question survey to current Eaze patients and received over 2,300 unique responses. This gave us a lot of data to play with, and our analysis explores the survey questions by both demographic (location, age, income, etc) and behavior (hour of delivery, revenue per day, frequency, etc). For Normal and VIP users, separate charts were created for each question in order to more clearly demonstrate the differences between the two customer segments. The 120+ summary charts we created, like the two below, illustrated the overall pattern in user preference and behavior.
The survey data and accompanying analysis was used to inform the user personas, customer experience map, and areas of opportunity for Eaze.
Q&Q Research | User Interviews
We recruited and interviewed 6 potential, 7 normal, and 8 VIP patients to explore and understand their behavior using medical marijuana, methods for obtaining it, and experiences ordering with Eaze. We asked open-ended questions to encourage full, meaningful answers and ordered the questions by lifecycle stage to guide the conversation from past experiences through their current relationship with Eaze. After each interview, we extracted notable insights from our conversations to identify possible trends in user behaviors or feelings.
I'd love to share, but the user interviews need to be kept hush hush.


Validated Personas
To help us journey through each customer type while considering the differences among them, we created validated personas derived from information provided in the qualitative user interviews. Each persona communicates our research insights and user goals to tell a coherent story capturing the purchasing behavior, needs, frustrations, and preferences of the specific customer segment.


Data Visualization
With a hefty amount of both qualitative and quantitative research and a thorough understanding of the relationship between Eaze and its patients, we began brainstorming the best way to layout the map and visualize our data.


I wanted to start off broad and get more granular as the reader moved down the map to provide them enough context before comparing user types. The guiding principles, and corresponding lifecycle stages, provide a general overview of the patient's entire experience which is then broken down by touchpoint and user actions in the Doing section. The reader is then able to compare user emotions in Thinking & Feeling and further interpret those differences based on the hard data shown in Quantitative Insights.
And now.. the map!
Interpretation | Results
After months of research, analysis, and mapping, these are a few of the gaps and insights we discovered in the current customer experience that I can divulge:
Menu
Patients would like more detailed information on the products in Eaze’s menu.
Roughly 30% of patients are very satisfied with the level of detail in product descriptions. Similarly, only ~44% of patients understand the product’s health benefits very well.
Opportunity: Eaze could provide additional product pictures and videos, greater detail on the effects and medicinal benefits, information on the product’s source, or links to external sources such as Leafly.
Product
Patients appreciate the personal interaction they receive when visiting a dispensary and would like to have a more individualized experience on Eaze.
- Patients, especially those in the normal customer segment, purchased medical marijuana frequently from dispensaries in addition to ordering with Eaze. To convert normal users to VIP users and improve retention, Eaze needs to make their service more attractive and convenient than purchasing from a dispensary.
Opportunity: To curate a tailored customer experience, live chat or phone support could be provided in addition to online reviews and recommendation to help patients choose the right product for their needs. Eaze could also provide recommendations based on user preferences or past order history, and additionally showcase show staff picks, special products, and user reviews.
Delivery Experience
Research found inconsistencies in delivery ETA to be a frequent painpoint and influence patient's likelihood to order with Eaze in the future.
- While most patients found delivery ETA estimates to be accurate, ~32% of patients experienced large inconsistencies with actual versus quoted delivery times
- Patients prefer the handoff to occur from the delivery location specified rather than from the driver’s car, and are confused or frustrated when the handoff differs from delivery to delivery.
- Customers who received their order with an average ETA of 20 minutes or less rated Eaze as having a higher value for the service it provides as compared to deliveries with ETA’s over 20 minutes.
Opportunity: There is room for Eaze to improve the accuracy and frequency of delivery text message updates. Also, even though a standard delivery protocol exists, Eaze's dispensary partners need to ensure a consistent handoff so patients know what to expect.
Design Reflections
The map can be used to guide company strategy, identify opportunities to enhance the customer experience, and differentiate the company from its competitors as the medical marijuana delivery industry becomes more crowded. It should be updated as Eaze grows and adapts its operations, marketing, and strategy.
Exploring Eaze's customers on both the supply and demand side will provide the company with a holistic view of their entire business. We recommend Eaze maps the customer experience for partners and drivers to examine their interactions with Eaze's software and patients. This is especially important to gain insight into delivery since this is the only in-person exchange between the supply and demand sides.